What’s a motif?
DNA motifs are specific patterns of DNA sequences with special functions. Common examples are TATA and CAAT boxes.
- TATA box : usually reads as TATAAA. This pattern is often found about 25 to 30 base paris before the transcription start site.
- CAAT box: usually reads as GGCCAATCT or CCTTGAGG, often found ~75 to 80 base pair before the transcription start site. The CAAT box is the binding site for the transcription factor CTF/NF1.
In computational biology and bioinformatics, DNA motifs are often represented as position weight matrices (PWMs) or position-specific scoring matrices (PSSMs).
These are 4 by n (n = length of the motif) matrices that store the probability or frequency of each nucleotide (A, C, G, T). For example, the matrix that encodes the TATAAA pattern - TATA box motif looks like this:
In reality, a motif will not have only binary values of 0 and 1, each position will have a combination of all 4 nucleotides, with some types more dominant than others.
A more realistic TATA box might look like this
In machine learning, these motifs can be used as filters/ kernels in a CNN model to extract “features” of the DNA sequence. Just like in CNNs for image processing, where filters are used to scan across the image to extract features like edges, shapes or textures, these DNA filters can also scan through the DNA sequence via 1d convolution.
As it scans across a DNA sequence, the kernel detect (pick up) the presence of these motifs/ patterns and the model can use these functional features to facilitate the learning.
Clustering motifs to assign colors
Machine learning models can be big, and a CNN model can have hundreds of motifs.
In our attempt to inspect the model during learning or try to build more interpretable models, we might need to visualize the activation patterns of a motif on a given sequence - which part of the sequence is this motif activating/ picking up signals?
When we have hundreds of motifs to show on the same sequence, if we randomly assign a different color to each motif, the annotation color on the sequence might look very messy. A more optimal way is to make the motifs that are similar to each other to have similar colors.
For example, the motif of TATAAA, TATAAT, TATATTA and other variants of the TATA box can all have different shades of blue, as they tend to activate similar locations on the sequence, the annotation colors would look more clear.
Clustering and coloring scheme: convolution, correlation and TSP solver
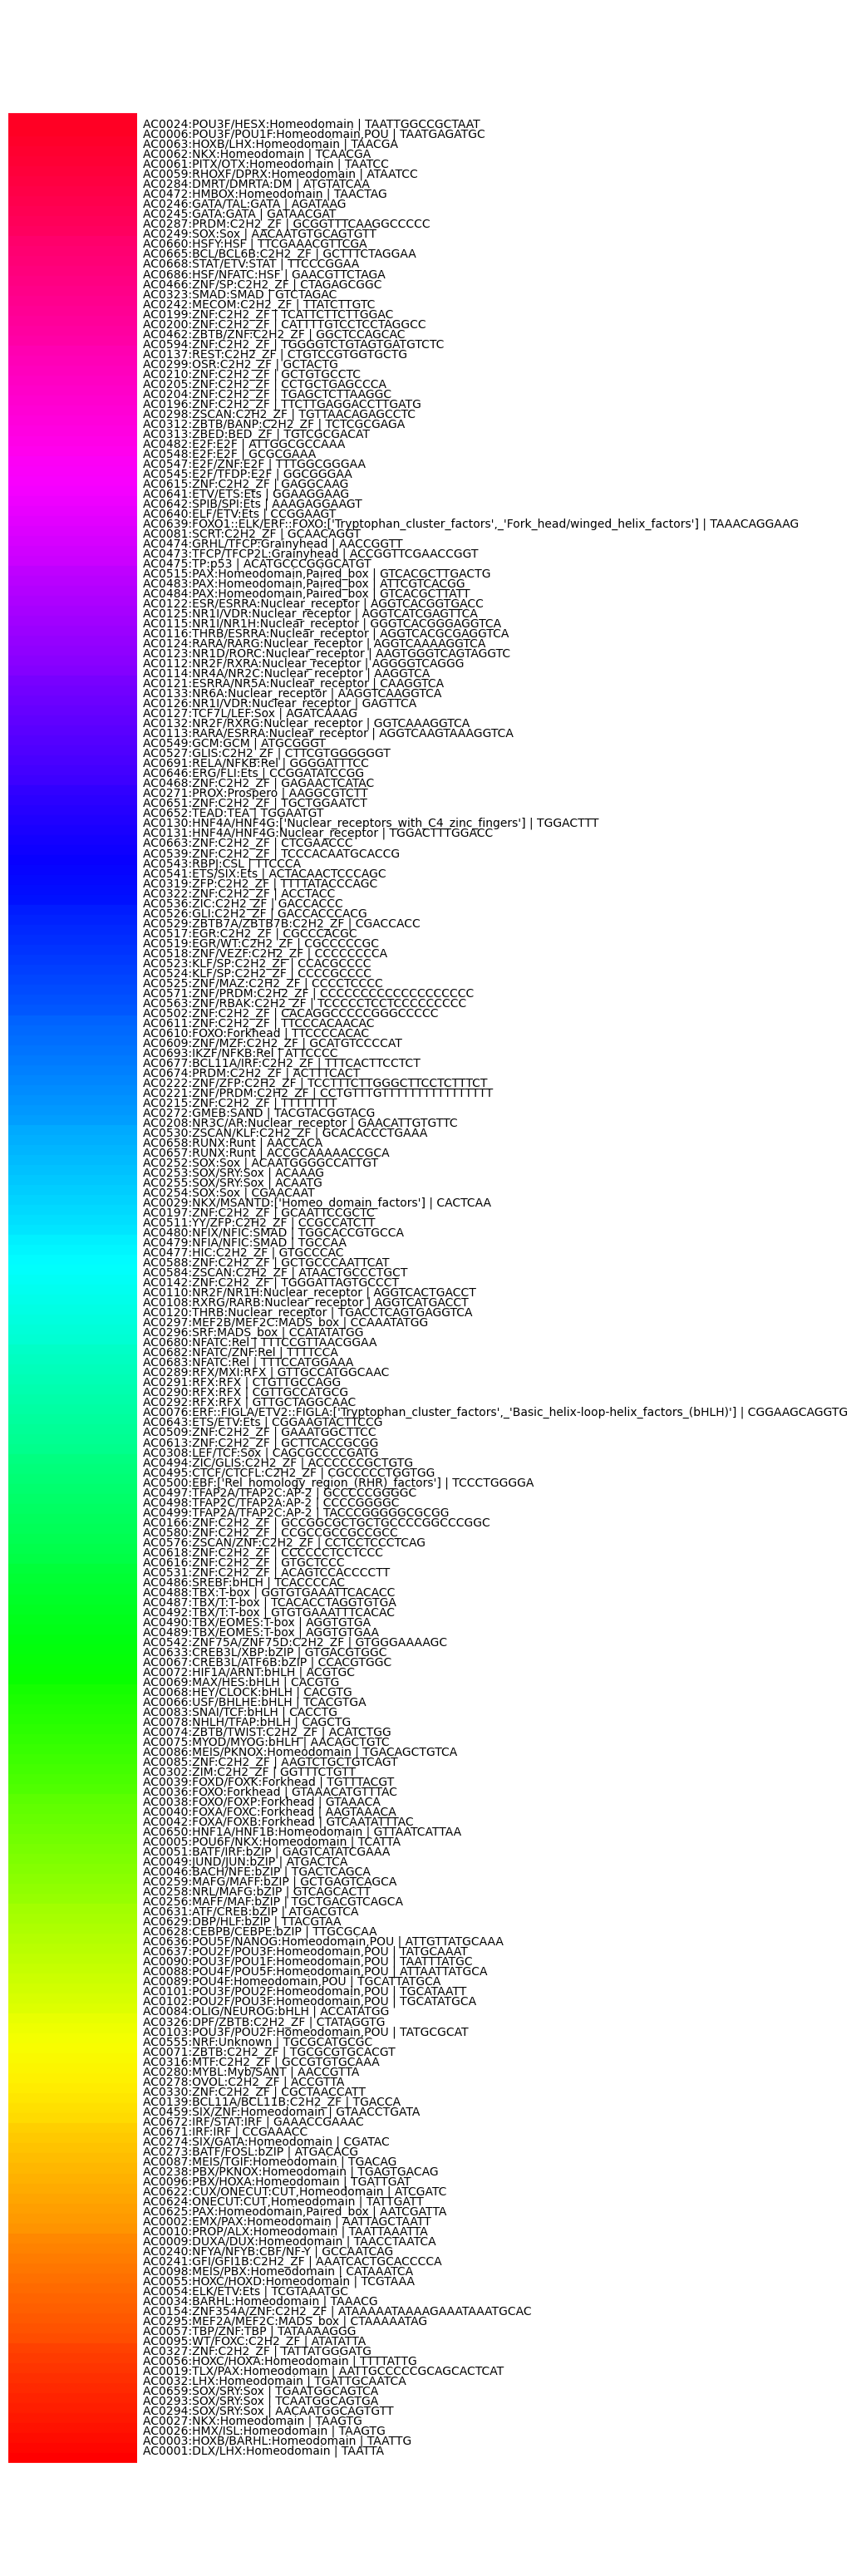
The goal is to map 243 motifs to 243 different colors, where motif with a similar pattern have similar colors.
To calculate “similarity”, we take a sample sequence, and convolve each motif on the sequence and compare their results. The convolution score at each base pair is further converted into an annotation score, representing the effect of the motif at this position. 1 The correlation between each pair of motifs’ annotation result is calculated, and is used as the distance between any two motifs. 2
Now we have the distance between any two motifs, we treat the problem as a traveling salesman problem (TSP): can we find a way to traverse all motifs, passing through each motif once and going back to the initial motif, and make the total distance as small as possible? This links all motifs into a loop, and the shortest distance would make it naturally that the motifs that are similar end up close to each other.
The correlation matrix (243 x 243) is treated as the distance matrix, and fed into the Concorde traveling salesman problem(TSP) solver to find the solution, which is a list of how to order these motifs to get the shortest path of the loop.
Lastly, the loop of motifs was mapped to a Hue color ring, to make closer motifs have similar colors.
A result of applying this process to a 1 million length sequence is as follows:
Footnotes
-
The kernel is used to first convolve a sequence (length n), which results in a 1 x n vector, then transposed convolve (deconvolve) to a 4 x n matrix, then the annotation score is calculated at each position by taking the deconvolution score of the original base pair (in the sequence), subtracted by the average value of the scores of the other 3 types of base pair. ↩
-
There’s also a threshold of annotation score, any score below that is set to zero. ↩